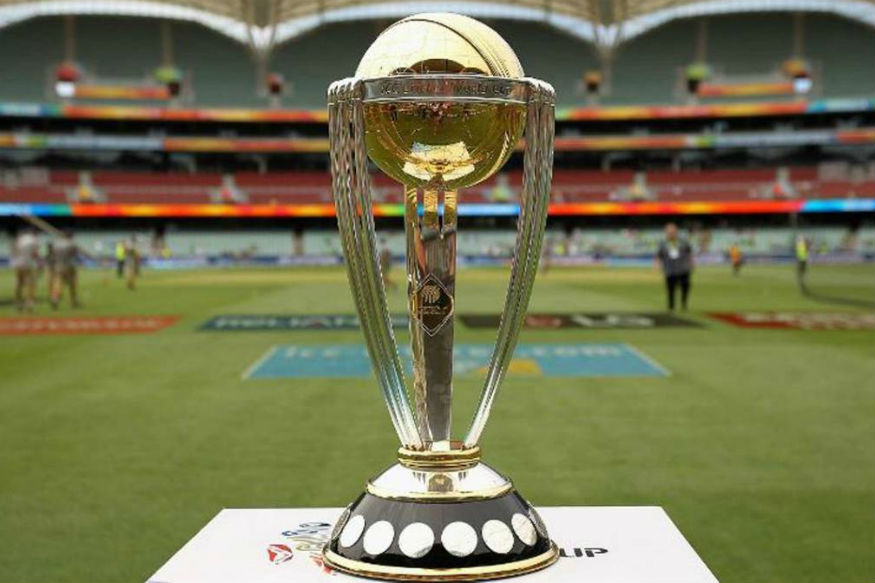
ICC World Cup 2019 | In Numbers: Standout ODI Trends Since 2015 World Cup

The 12th edition of cricket’s most prestigious tournament – the World Cup gets underway in England from the 30th of May. While England start as firm favourites at home there are four to five other teams that will challenge them for the trophy – coupled with that the format of the World Cup and this has the potential to be one of the most competitive and closely fought tournaments in history.
How have the 10 competing teams fared since the last World Cup? Why is England the hot favourite at home? How has India’s recent form been going into the World Cup? Who are the standout batsmen in this period? Who are the best bowlers?
England has the highest win-loss ratio from the end of WC 2015 to now (14th May, 2019). They also have the highest series/tournament winning percentage of 73.68% - they have won 14 of the 19 series/tournaments they have played in this time-frame and are well on their way to win another (ongoing home series against Pakistan).
Both, England and India have the joint-highest winning percentage (matches won/matches played) in this period.
India has the maximum differential (of 10.37) between batting average (42.34) and bowling average (31.97) post WC 2015.
They also have the longest bilateral series winning streak in this period having won 9 consecutive series from June, 2016 (India in Zimbabwe) to February, 2018 (India in South Africa).
